{"success":true,"data":{"web":[{"url":"https://effect.website/docs/additional-resources/myths/","title":"Myths About Effect | Effect Documentation","description":"The bundle size is HUGE! Effect's minimum cost is about 25k of gzipped code, that chunk contains the Effect Runtime and already includes almost all the ...","position":1,"markdown":"[Skip to content](https://effect.website/docs/additional-resources/myths/#_top)\n\n# Myths About Effect\n\n## Effect heavily relies on generators and generators are slow!\n\nEffect’s internals are not built on generators, we only use generators to provide an API which closely mimics async-await. Internally async-await uses the same mechanics as generators and they are equally performant. So if you don’t have a problem with async-await you won’t have a problem with Effect’s generators.\n\nWhere generators and iterables are unacceptably slow is in transforming collections of data, for that try to use plain arrays as much as possible.\n\n## Effect will make your code 500x slower!\n\nEffect does perform 500x slower if you are comparing:\n\n```\nconst result = 1 + 1\n```\n\nto\n\n```\nimport { Effect } from \"effect\"\n\nconst result = Effect.runSync(\n\n Effect.zipWith(Effect.succeed(1), Effect.succeed(1), (a, b) => a + b)\n\n)\n```\n\nThe reason is one operation is optimized by the JIT compiler to be a direct CPU instruction and the other isn’t.\n\nIn reality you’d never use Effect in such cases, Effect is an app-level library to tame concurrency, error handling, and much more!\n\nYou’d use Effect to coordinate your thunks of code, and you can build your thunks of code in the best perfoming manner as you see fit while still controlling execution through Effect.\n\n## Effect has a huge performance overhead!\n\nDepends what you mean by performance, many times performance bottlenecks in JS are due to bad management of concurrency.\n\nThanks to structured concurrency and observability it becomes much easier to spot and optimize those issues.\n\nThere are apps in frontend running at 120fps that use Effect intensively, so most likely effect won’t be your perf problem.\n\nIn regards of memory, it doesn’t use much more memory than a normal program would, there are a few more allocations compared to non Effect code but usually this is no longer the case when the non Effect code does the same thing as the Effect code.\n\nThe advice would be start using it and monitor your code, optimise out of need not out of thought, optimizing too early is the root of all evils in software design.\n\n## The bundle size is HUGE!\n\nEffect’s minimum cost is about 25k of gzipped code, that chunk contains the Effect Runtime and already includes almost all the functions that you’ll need in a normal app-code scenario.\n\nFrom that point on Effect is tree-shaking friendly so you’ll only include what you use.\n\nAlso when using Effect your own code becomes shorter and terser, so the overall cost is amortized with usage, we have apps where adopting Effect in the majority of the codebase led to reduction of the final bundle.\n\n## Effect is impossible to learn, there are so many functions and modules!\n\nTrue, the full Effect ecosystem is quite large and some modules contain 1000s of functions, the reality is that you don’t need to know them all to start being productive, you can safely start using Effect knowing just 10-20 functions and progressively discover the rest, just like you can start using TypeScript without knowing every single NPM package.\n\nA short list of commonly used functions to begin are:\n\n- [Effect.succeed](https://effect.website/docs/getting-started/creating-effects/#succeed)\n- [Effect.fail](https://effect.website/docs/getting-started/creating-effects/#fail)\n- [Effect.sync](https://effect.website/docs/getting-started/creating-effects/#sync)\n- [Effect.tryPromise](https://effect.website/docs/getting-started/creating-effects/#trypromise)\n- [Effect.gen](https://effect.website/docs/getting-started/using-generators/)\n- [Effect.runPromise](https://effect.website/docs/getting-started/running-effects/#runpromise)\n- [Effect.catchTag](https://effect.website/docs/error-management/expected-errors/#catchtag)\n- [Effect.catchAll](https://effect.website/docs/error-management/expected-errors/#catchall)\n- [Effect.acquireRelease](https://effect.website/docs/resource-management/scope/#acquirerelease)\n- [Effect.acquireUseRelease](https://effect.website/docs/resource-management/introduction/#acquireuserelease)\n- [Effect.provide](https://effect.website/docs/requirements-management/layers/#providing-a-layer-to-an-effect)\n- [Effect.provideService](https://effect.website/docs/requirements-management/services/#providing-a-service-implementation)\n- [Effect.andThen](https://effect.website/docs/getting-started/building-pipelines/#andthen)\n- [Effect.map](https://effect.website/docs/getting-started/building-pipelines/#map)\n- [Effect.tap](https://effect.website/docs/getting-started/building-pipelines/#tap)\n\nA short list of commonly used modules:\n\n- [Effect](https://effect-ts.github.io/effect/effect/Effect.ts.html)\n- [Context](https://effect.website/docs/requirements-management/services/#creating-a-service)\n- [Layer](https://effect.website/docs/requirements-management/layers/)\n- [Option](https://effect.website/docs/data-types/option/)\n- [Either](https://effect.website/docs/data-types/either/)\n- [Array](https://effect-ts.github.io/effect/effect/Array.ts.html)\n- [Match](https://effect.website/docs/code-style/pattern-matching/)\n\n## Effect is the same as RxJS and shares its problems\n\nThis is a sensitive topic, let’s start by saying that RxJS is a great project and that it has helped millions of developers write reliable software and we all should be thankful to the developers who contributed to such an amazing project.\n\nDiscussing the scope of the projects, RxJS aims to make working with Observables easy and wants to provide reactive extensions to JS, Effect instead wants to make writing production-grade TypeScript easy. While the intersection is non-empty the projects have fundamentally different objectives and strategies.\n\nSometimes people refer to RxJS in bad light, and the reason isn’t RxJS in itself but rather usage of RxJS in problem domains where RxJS wasn’t thought to be used.\n\nNamely the idea that “everything is a stream” is theoretically true but it leads to fundamental limitations on developer experience, the primary issue being that streams are multi-shot (emit potentially multiple elements, or zero) and mutable delimited continuations (JS Generators) are known to be only good to represent single-shot effects (that emit a single value).\n\nIn short it means that writing in imperative style (think of async/await) is practically impossible with stream primitives (practically because there would be the option of replaying the generator at every element and at every step, but this tends to be inefficient and the semantics of it are counter-intuitive, it would only work under the assumption that the full body is free of side-effects), forcing the developer to use declarative approaches such as pipe to represent all of their code.\n\nEffect has a Stream module (which is pull-based instead of push-based in order to be memory constant), but the basic Effect type is single-shot and it is optimised to act as a smart & lazy Promise that enables imperative programming, so when using Effect you’re not forced to use a declarative style for everything and you can program using a model which is similar to async-await.\n\nThe other big difference is that RxJS only cares about the happy-path with explicit types, it doesn’t offer a way of typing errors and dependencies, Effect instead consider both errors and dependencies as explicitely typed and offers control-flow around those in a fully type-safe manner.\n\nIn short if you need reactive programming around Observables, use RxJS, if you need to write production-grade TypeScript that includes by default native telemetry, error handling, dependency injection, and more use Effect.\n\n## Effect should be a language or Use a different language\n\nNeither solve the issue of writing production grade software in TypeScript.\n\nTypeScript is an amazing language to write full stack code with deep roots in the JS ecosystem and wide compatibility of tools, it is an industrial language adopted by many large scale companies.\n\nThe fact that something like Effect is possible within the language and the fact that the language supports things such as generators that allows for imperative programming with custom types such as Effect makes TypeScript a unique language.\n\nIn fact even in functional languages such as Scala the interop with effect systems is less optimal than it is in TypeScript, to the point that effect system authors have expressed wish for their language to support as much as TypeScript supports.\n\nClearClose\n\nType to search. Use arrow keys to navigate results. Press Enter to select. Press Escape to close.\n\n\nSearch powered by [Mixedbread](https://mixedbread.com/)\n\n↑↓to navigate↵to selectescto close","metadata":{"og:description":"Debunking common misconceptions about Effect's performance, complexity, and use cases.","description":"Debunking common misconceptions about Effect's performance, complexity, and use cases.","twitter:image":"https://effect.website/open-graph/docs/additional-resources/myths.png","og:image":"https://effect.website/open-graph/docs/additional-resources/myths.png","generator":["Astro v5.12.8","Starlight v0.32.6"],"twitter:card":"summary_large_image","ogImage":"https://effect.website/open-graph/docs/additional-resources/myths.png","ogUrl":"https://effect.website/docs/additional-resources/myths/","viewport":"width=device-width, initial-scale=1","language":"en","ogDescription":"Debunking common misconceptions about Effect's performance, complexity, and use cases.","og:url":"https://effect.website/docs/additional-resources/myths/","ogTitle":"Myths About Effect","og:locale":"en","og:type":"article","title":"Myths About Effect | Effect Documentation","ogLocale":"en","og:title":"Myths About Effect","ogSiteName":"Effect Documentation","og:site_name":"Effect Documentation","favicon":"https://effect.website/favicon.png","scrapeId":"019d3958-259f-74ed-8ae7-f7874d1a2725","sourceURL":"https://effect.website/docs/additional-resources/myths/","url":"https://effect.website/docs/additional-resources/myths/","statusCode":200,"contentType":"text/html; charset=utf-8","proxyUsed":"basic","cacheState":"hit","cachedAt":"2026-03-28T19:03:38.974Z","creditsUsed":1}},{"url":"https://nolanlawson.com/2021/02/23/javascript-performance-beyond-bundle-size/","title":"JavaScript performance beyond bundle size | Read the Tea Leaves","description":"The compressed size affects how fast it is to send bytes over the wire, whereas the uncompressed size affects how long it takes the browser to ...","position":2,"markdown":"- [Home](https://nolanlawson.com/)\n- [Apps](https://nolanlawson.com/apps/)\n- [Code](https://nolanlawson.com/code/)\n- [Talks](https://nolanlawson.com/talks/)\n- [About](https://nolanlawson.com/about/)\n\n23Feb\n\n## JavaScript performance beyond bundle size\n\nPosted February 23, 2021 by Nolan Lawson in [performance](https://nolanlawson.com/category/performance/), [Web](https://nolanlawson.com/category/web/). [8 Comments](https://nolanlawson.com/2021/02/23/javascript-performance-beyond-bundle-size/#comments)\n\nThere’s [an old story](https://en.wikipedia.org/wiki/Streetlight_effect) about a drunk trying to find his keys in the streetlight. Why? Well, because that’s where it’s the brightest. It’s a funny story, but also relatable, because as humans we all tend to take the path of least resistance.\n\nI think we have the same problem in the web performance community. There’s a huge focus recently on JavaScript bundle size: how big are your dependencies? Could you use a smaller one? Could you lazy-load it? But I believe we focus on bundle size first and foremost because it’s easy to measure.\n\nThat’s not to say that bundle size isn’t important! Just like how you _might_ have left your keys in the streetlight. And heck, you might as well check there first, since it’s the quickest place to look. But here are some other things that are harder to measure, but can be just as important:\n\n- Parse/compile time\n- Execution time\n- Power usage\n- Memory usage\n- Disk usage\n\nA JavaScript dependency can affect all of these metrics. But they’re less discussed than bundle size, and I suspect it’s because they’re less straightforward to measure. In this post, I want to talk about how I approach bundle size, and how I approach the other metrics too.\n\n## Bundle size\n\nWhen talking about the size of JavaScript code, you have to be precise. Some folks will say “my library is 10 kilobytes.” Is that minified? Gzipped? Tree-shaken? Did you use the highest Gzip setting (9)? What about Brotli compression?\n\nThis may sound like hair-splitting, but the distinction actually matters, especially between compressed and uncompressed size. The compressed size affects how fast it is to send bytes over the wire, whereas the uncompressed size affects how long it takes the browser to parse, compile, and execute the JavaScript. (These tend to correlate with code size, although it’s not a perfect predictor.)\n\nThe most important thing, though, is to be consistent. You don’t want to measure Library A using unminified, uncompressed size versus Library B using minified and compressed size (unless there’s a real difference in how you’re serving them).\n\n### Bundlephobia\n\nFor me, [Bundlephobia](https://bundlephobia.com/) is the Swiss Army knife of bundle size analysis. You can look up any dependency from npm and it will tell you both the minified size (what the browser parses and executes) as well as the minified and compressed size (what the browser downloads).\n\nFor instance, we can use this tool to see that [`react-dom`](https://bundlephobia.com/result?p=react-dom@17.0.1) weighs 121.1kB minified, but [`preact`](https://bundlephobia.com/result?p=preact@10.5.12) weighs 10.2kB. So we can confirm that Preact [really is](https://preactjs.com/guide/v10/differences-to-react) the honest goods – a React-compatible framework at a fraction of the size!\n\nIn this case, I don’t get hung up on exactly which minifier or exactly what Gzip compression level Bundlephobia is using, because at least it’s using the same system everywhere. So I know I’m comparing apples to apples.\n\nNow that said, there are some caveats with Bundlephobia:\n\n1. It doesn’t tell you the tree-shaken cost. If you’re only importing one part of a module, the other parts may be tree-shaken out.\n2. It won’t tell you about subdirectory dependencies. So for instance, I know how expensive it is to `import 'preact'`, but `import 'preact/compat'` could be literally anything – `compat.js` could be a huge file, and I’d have no way to know.\n3. If there are polyfills involved (e.g. your bundler injecting a polyfill for Node’s `Buffer` API, or for the JavaScript `Object.assign()` API), you won’t necessarily see it here.\n\nIn all the above cases, you really just have to run your bundler and check the output. Every bundler is different, and depending on the configuration or other factors, you might end up with a huge bundle or a tiny one. So next, let’s move on to the bundler-specific tools.\n\n### Webpack Bundle Analyzer\n\nI love [Webpack Bundle Analyzer](https://github.com/webpack-contrib/webpack-bundle-analyzer). It offers a nice visualization of every chunk in your Webpack output, as well as which modules are inside of those chunks.\n\n[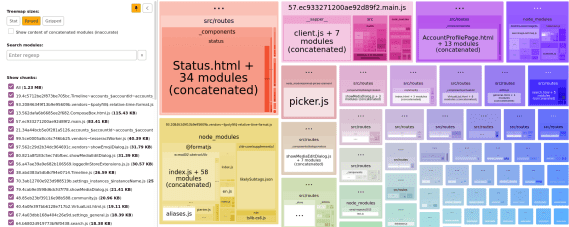](https://nolanlawson.com/wp-content/uploads/2021/02/screenshot-from-2021-02-20-09-45-39.png)\n\nIn terms of [the sizes it shows](https://github.com/webpack-contrib/webpack-bundle-analyzer#size-definitions), the two most useful ones are “parsed” (the default) and “Gzipped”. “Parsed” essentially means “minified,” so these two measurements are roughly comparable with what Bundlephobia would tell us. But the difference here is that we’re actually running our bundler, so we know that the sizes are accurate for our particular application.\n\n### Rollup Plugin Analyzer\n\nFor Rollup, I would really love to have a graphical interface like Webpack Bundle Analyzer. But the next best thing I’ve found is [Rollup Plugin Analyer](https://github.com/doesdev/rollup-plugin-analyzer), which will output your module sizes to the console while building.\n\nUnfortunately, this tool doesn’t give us the minified or Gzipped size – just the size [as seen by Rollup](https://github.com/doesdev/rollup-plugin-analyzer#why-is-the-reported-size-not-the-same-as-the-file-on-disk) before such optimizations occur. It’s not perfect, but it’s great in a pinch.\n\n### Other bundle size tools\n\nOther tools I’ve dabbled with and found useful:\n\n- [bundlesize](https://github.com/siddharthkp/bundlesize)\n- [Bundle Buddy](https://www.bundle-buddy.com/webpack)\n- [Sourcemap Explorer](https://github.com/danvk/source-map-explorer)\n- [Webpack Analyse](http://webpack.github.io/analyse/)\n\nI’m sure you can find other tools to add to this list!\n\n## Beyond the bundle\n\nAs I mentioned, though, I don’t think JavaScript bundle size is everything. It’s great as a first approximation, because it’s (comparatively) easy to measure, but there are plenty of other metrics that can impact page performance.\n\n### Runtime CPU cost\n\nThe first and most important one is the runtime cost. This can be broken into a few buckets:\n\n- Parsing\n- Compilation\n- Execution\n\nThese three phases are basically the end-to-end cost of calling `require(\"some-dependency\")` or `import \"some-dependency\"`. They may correlate with bundle size, but it’s not a one-to-one mapping.\n\nFor a trivial example, here is a (tiny!) JavaScript snippet that consumes a ton of CPU:\n\n| | |\n| --- | --- |\n| 1
2 | `const start = Date.now()`
`while``(Date.now() - start < 5000) {}` |\n\nThis snippet would get a great score on Bundlephobia, but unfortunately it will block the main thread for 5 seconds. This is a somewhat absurd example, but in the real world, you can find small libraries that nonetheless hammer the main thread. Traversing through all elements in the DOM, iterating through a large array in LocalStorage, calculating digits of pi… unless you’ve hand-inspected all your dependencies, it’s hard to know what they’re doing in there.\n\nParsing and compilation are both really hard to measure. It’s easy to fool yourself, because browsers have lots of optimizations around [bytecode caching](https://v8.dev/blog/code-caching-for-devs). For instance, browsers might not run the parse/compile step on second page load, or [third page load](https://v8.dev/blog/v8-release-66#code-caching-after-execution) (!), or when the JavaScript is cached in a Service Worker. So you might think a module is cheap to parse/compile, when really the browser has just cached it in advance.\n\n[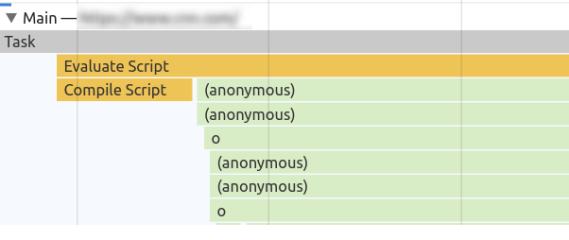](https://nolanlawson.com/wp-content/uploads/2021/02/screenshot-from-2021-02-22-21-02-33.png)\n\nCompilation and execution in Chrome DevTools. Note that Chrome does some parsing and compilation [off-main-thread](https://v8.dev/blog/cost-of-javascript-2019#v8-improvements).\n\nThe only way to be 100% safe is to completely clear the browser cache and measure first page load. I don’t like to mess around, so typically I will do this in a private/guest browsing window, or in a completely separate browser. You’ll also want to make sure that any browser extensions are disabled (private mode typically does this), since those extensions can impact page load time. You don’t want to get halfway into analyzing a Chrome trace and realize that you’re measuring your password manager!\n\nAnother thing I usually do is set Chrome’s CPU throttling to 4x or 6x. I think of 4x as “similar enough to a mobile device,” and 6x as “a super-duper slowed-down machine that makes the traces much easier to read, because everything is bigger.” Use whichever one you want; either will be more representative of real users than your (probably) high-end developer machine.\n\nIf I’m concerned about network speed, this is the point where I would turn on network throttling as well. “Fast 3G” is usually a good one that hits the sweet spot between “more like the real world” and “not so slow that I start yelling at my computer.”\n\nSo putting it all together, my steps for getting an accurate trace are typically:\n\n1. Open a private/guest browsing window.\n2. Navigate to `about:blank` if necessary (you don’t want to measure the `unload` event for your browser home page).\n3. Open the DevTools in Chrome.\n4. Go to the Performance tab.\n5. In the settings, turn on CPU throttling and/or network throttling.\n6. Click the Record button.\n7. Type the URL and press Enter.\n8. Stop recording when the page has loaded.\n\n[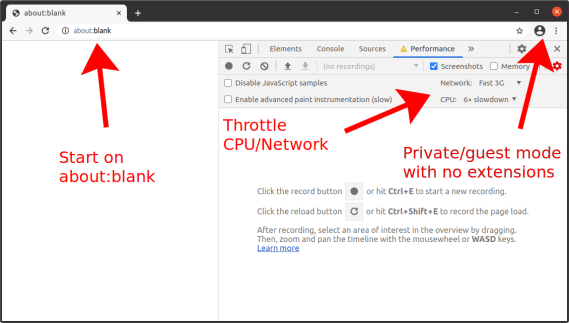](https://nolanlawson.com/wp-content/uploads/2021/02/screenshot-from-2021-02-20-14-58-18.png)\n\nNow you have a performance trace (also known as a “timeline” or “profile”), which will show you the parse/compile/execution times for the JavaScript code in your initial page load. Unfortunately this part can end up being pretty manual, but there are some tricks to make it easier.\n\nMost importantly, use the [User Timing API](https://developer.mozilla.org/en-US/docs/Web/API/User_Timing_API) (aka performance marks and measures) to mark parts of your web application with names that are meaningful to you. Focus on parts that you worry will be expensive, such as the initial render of your root application, a blocking XHR call, or bootstrapping your state object.\n\nYou can strip out `performance.mark`/`performance.measure` calls in production if you’re worried about the (small) overhead of these APIs. I like to turn it on or off [based on query string parameters](https://github.com/nolanlawson/pinafore/blob/ba3b76f769455908eca9f6f59584d18e2bd19f0e/src/routes/_utils/marks.js), so that I can easily turn on user timings in production if I want to analyze the production build. Terser’s [`pure_funcs` option](https://terser.org/docs/api-reference.html#compress-options) can also be used to remove `performance.mark` and `performance.measure` calls when you minify. (Heck, you can remove `console.log`s here too. It’s very handy.)\n\nAnother useful tool is [`mark-loader`](https://github.com/statianzo/mark-loader), which is a Webpack plugin that automatically wraps your modules in mark/measure calls so that you can see each dependency’s runtime cost. Why try to puzzle over a JavaScript call stack, when the tool can tell you exactly which dependencies are consuming exactly how much time?\n\n[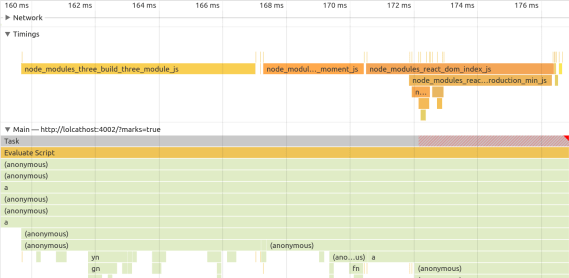](https://nolanlawson.com/wp-content/uploads/2021/02/screenshot-from-2021-02-22-22-02-23.png)\n\nLoading Three.js, Moment, and React in production mode. Without the User Timings, would you be able to figure out where the time is being spent?\n\nOne thing to be aware of when measuring runtime performance is that the costs can vary between minified and unminified code. Unused functions may be stripped out, code will be smaller and more optimized, and libraries may define `process.env.NODE_ENV === 'development'` blocks that don’t run in production mode.\n\nMy general strategy for dealing with this situation is to treat the minified, production build as the source of truth, and to use marks and measures to make it comprehensible. As mentioned, though, `performance.mark` and `performance.measure` have their own small overhead, so you may want to toggle them with query string parameters.\n\n### Power usage\n\nYou don’t have to be an environmentalist to think that minimizing power use is important. We live in a world where people are increasingly browsing the web on devices that aren’t plugged into a power outlet, and the last thing they want is to run out of juice because of a misbehaving website.\n\nI tend to think of power usage as a subset of CPU usage. There are some exceptions to this, like [waking up the radio for a network connection](https://hpbn.co/mobile-networks/#radio-resource-controller-rrc), but most of the time, if a website is consuming excessive power, it’s because it’s consuming excessive CPU on the main thread.\n\nSo everything I’ve said above about improving JavaScript parse/compile/execute time will also reduce power consumption. But for long-lived web applications especially, the most insidious form of power drain comes after first page load. This might manifest as a user suddenly noticing that their laptop fan is whirring or their phone is growing hot, even though they’re just looking at an (apparently) idle webpage.\n\nOnce again, the tool of choice in these situations is the Chrome DevTools Performance tab, using essentially the same steps described above. What you’ll want to look for, though, is repeated CPU usage, usually due to timers or animations. For instance, a poorly-coded custom scrollbar, an [IntersectionObserver](https://developer.mozilla.org/en-US/docs/Web/API/IntersectionObserver) polyfill, or an animated loading spinner may decide that they need to run code in every `requestAnimationFrame` or in a `setInterval` loop.\n\n[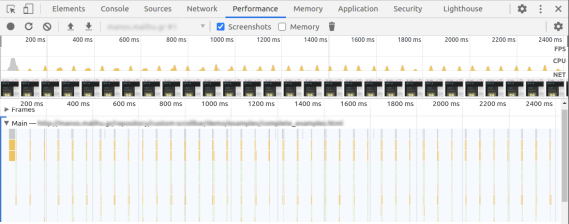](https://nolanlawson.com/wp-content/uploads/2021/02/screenshot-from-2021-02-20-15-19-13.png)\n\nA poorly-behaved JavaScript widget. Notice the little peaks of JavaScript usage, showing constant CPU usage even while the page is idle.\n\nNote that this kind of power drain can also occur due to unoptimized CSS animations – no JavaScript required! (In that case, it would be purple peaks rather than yellow peaks in the Chrome UI.) For long-running CSS animations, be sure to always prefer [GPU-accelerated](https://www.html5rocks.com/en/tutorials/speed/high-performance-animations/) CSS properties.\n\nAnother tool you can use is Chrome’s [Performance Monitor](https://developers.google.com/web/updates/2017/11/devtools-release-notes#perf-monitor) tab, which is actually different from the Performance tab. I see this as a sort of heartbeat monitor of how your website is doing perf-wise, without the hassle of manually starting and stopping a trace. If you see constant CPU usage here on an otherwise inert webpage, then you probably have a power usage problem.\n\n[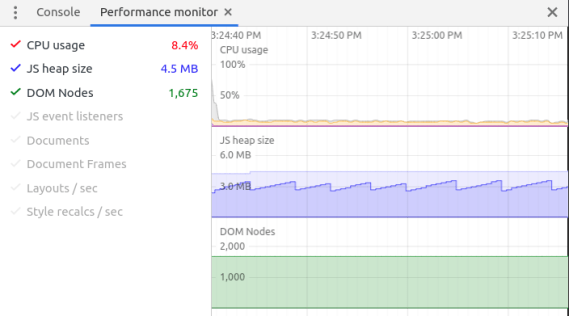](https://nolanlawson.com/wp-content/uploads/2021/02/screenshot-from-2021-02-20-15-25-10.png)\n\nThe same poorly-behaved JavaScript widget in Performance Monitor. Note the constant low hum of CPU usage, as well as the sawtooth pattern in the memory usage, indicating memory constantly being allocated and de-allocated.\n\nAlso: hat tip to the WebKit folks, who added an explicit [Energy Impact](https://webkit.org/blog/8970/how-web-content-can-affect-power-usage/) panel to the Safari Web Inspector. Another good tool to check out!\n\n### Memory usage\n\nMemory usage is something that used to be much harder to analyze, but the tooling has improved a lot recently.\n\nI already wrote [a post about memory leaks](https://nolanlawson.com/2020/02/19/fixing-memory-leaks-in-web-applications/) last year, but it’s important to remember that memory _usage_ and memory _leaks_ are two separate problems. A website can have high memory usage without explicitly leaking memory. Whereas another website could start small, but eventually balloon to a huge size due to runaway leaks.\n\nYou can read the above blog post for how to analyze memory leaks. But in terms of memory usage, we have a new browser API that helps quite a bit with measuring it: [`performance.measureUserAgentSpecificMemory`](https://www.chromestatus.com/feature/5685965186138112) (formerly `performance.measureMemory`, which sadly was much less of a mouthful). There are several advantages of this API:\n\n1. It returns a promise that automatically resolves _after_ garbage collection. (No more need for [weird hacks](https://stackoverflow.com/questions/13950394/forcing-garbage-collection-in-google-chrome) to force GC!)\n2. It measures more than just JavaScript VM size – it also includes DOM memory as well as memory in web workers and iframes.\n3. In the case of cross-origin iframes, which are process-isolated due to [Site Isolation](https://www.chromium.org/Home/chromium-security/site-isolation), it will break down the attribution. So you can know exactly how memory-hungry your ads and embeds are!\n\nHere is a sample output from the API:\n\n| | |\n| --- | --- |\n| 1
2
3
4
5
6
7
8
9
10
11
12
13
14
15 | `{`
```\"breakdown\"``: [`
```{`
```\"attribution\"``: [``\"https://pinafore.social/\"``],`
```\"bytes\"``: 755360,`
```\"types\"``: [``\"Window\"``,``\"JS\"``]`
```},`
```{`
```\"attribution\"``: [],`
```\"bytes\"``: 804322,`
```\"types\"``: [``\"Window\"``,``\"JS\"``,``\"Shared\"``]`
```}`
```],`
```\"bytes\"``: 1559682`
`}` |\n\nIn this case, `bytes` is the banner metric you’ll want to use for “how much memory am I using?” The `breakdown` is optional, and the spec explicitly notes that [browsers can decide not to include it](https://wicg.github.io/performance-measure-memory/#examples).\n\nThat said, it can still be finicky to use this API. First off, it’s only available in Chrome 89+. (In slightly older releases, you can set the “enable experimental web platform features” flag and use the old `performance.measureMemory` API.) More problematic, though, is that due to the potential for abuse, this API has been limited to [cross-origin isolated contexts](https://web.dev/why-coop-coep/). This effectively means that you have to set some [special headers](https://web.dev/coop-coep/), and if you rely on any cross-origin resources (external CSS, JavaScript, images, etc.), they’ll need to set some special headers too.\n\nIf that sounds like too much trouble, though, and if you only plan to use this API for automated testing, then you can run Chrome with the [`--disable-web-security` flag](https://stackoverflow.com/a/58658101/6807420). (At your own risk, of course!) Note, though, that measuring memory currently [doesn’t work in headless mode](https://bugs.chromium.org/p/chromium/issues/detail?id=1129535).\n\nOf course, this API also doesn’t give you a great level of granularity. You won’t be able to figure out, for instance, that React takes up X number of bytes, and Lodash takes up Y bytes, etc. A/B testing may be the only effective way to figure that kind of thing out. But this is still much better than the older tooling we had for measuring memory (which is so flawed that it’s really not even worth describing).\n\n### Disk usage\n\nLimiting disk usage is most important in web application scenarios, where it’s possible to reach browser [quota limits](https://web.dev/storage-for-the-web/) depending on the amount of available storage on the device. Excessive storage usage can come in many forms, such as stuffing too many [large images](https://speedcurve.com/blog/web-performance-page-bloat/) into the [ServiceWorker cache](https://developer.mozilla.org/en-US/docs/Web/API/CacheStorage), but JavaScript can add up too.\n\nYou might think that the disk usage of a JavaScript module is a direct correlate of its bundle size (i.e. the cost of caching it), but there are some cases were this isn’t true. For instance, with my own [`emoji-picker-element`](https://github.com/nolanlawson/emoji-picker-element), I make heavy use of [IndexedDB](https://developer.mozilla.org/en-US/docs/Web/API/IndexedDB_API/Using_IndexedDB) to store the emoji data. This means I have to be cognizant of database-related disk usage, such as storing unnecessary data or creating excessive indexes.\n\n[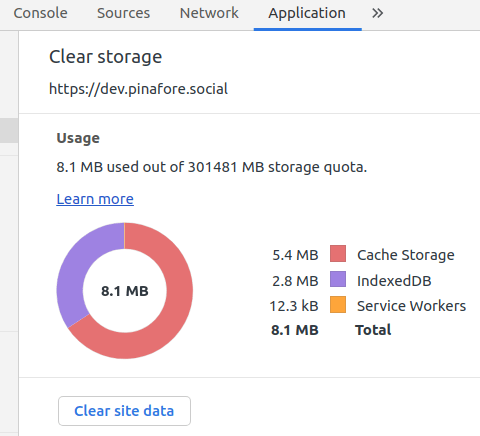](https://nolanlawson.com/wp-content/uploads/2021/02/screenshot-from-2021-02-20-16-07-19.png)\n\nThe Chrome DevTools has an [“Application” tab](https://developers.google.com/web/tools/chrome-devtools/progressive-web-apps) which shows the total storage usage for a website. This is pretty good as a first approximation, but I’ve found that this screen can be a little bit inconsistent, and also the data has to be gathered manually. Plus, I’m interested in more than just Chrome, since IndexedDB has vastly different implementations across browsers, so the storage size could vary wildly.\n\nThe solution I landed on is a [small script](https://github.com/nolanlawson/emoji-picker-element/blob/67f7c81c987b9bb9782a942523f5e6d83f430675/test/storage/test.js#L20-L29) that launches [Playwright](https://github.com/microsoft/playwright), which is a [Puppeteer](https://pptr.dev/)-like tool that has the advantage of being able to launch more browsers than just Chrome. Another neat feature is that it can launch browsers with a fresh storage area, so you can launch a browser, write storage to `/tmp`, and then measure the IndexedDB usage for each browser.\n\nTo give you an example, here is what I get for the current version of `emoji-picker-element`:\n\n| Browser | IndexedDB directory size |\n| --- | --- |\n| Chromium | 2.13 MB |\n| Firefox | 1.37 MB |\n| WebKit | 2.17 MB |\n\nOf course, you would have to adapt this script if you wanted to measure the storage size of the ServiceWorker cache, [LocalStorage](https://developer.mozilla.org/en-US/docs/Web/API/Window/localStorage), etc.\n\nAnother option, which might work better in a production environment, would be the [`StorageManager.estimate()`](https://developer.mozilla.org/en-US/docs/Web/API/StorageManager/estimate) API. However, this is designed more for figuring out if you’re approaching quota limits rather than performance analysis, so I’m not sure how accurate it would be as a disk usage metric. As MDN notes: “The returned values are not exact; between compression, deduplication, and obfuscation for security reasons, they will be imprecise.”\n\n## Conclusion\n\nPerformance is a multi-faceted thing. It would be great if we could reduce it down to a single metric such as bundle size, but if you really want to cover all the bases, there are a lot of different angles to consider.\n\nSometimes this can feel overwhelming, which is why I think initiatives like the [Core Web Vitals](https://web.dev/vitals/), or a general focus on bundle size, aren’t such a bad thing. If you tell people they need to optimize a dozen different metrics, they may just decide not to optimize any of them.\n\nThat said, for JavaScript dependencies in particular, I would love if it were easier to see all of these metrics at a glance. Imagine if Bundlephobia had a “Nutrition Facts”-type view, with bundle size as the headline metric (sort of like calories!), and all the other metrics listed below. It wouldn’t have to be precise: the numbers might depend on the browser, the size of the DOM, how the API is used, etc. But you could imagine some basic stats around initial CPU execution time, memory usage, and disk usage that wouldn’t be impossible to measure in an automated way.\n\nIf such a thing existed, it would be a lot easier to make informed decisions about which JavaScript dependencies to use, whether to lazy-load them, etc. But in the meantime, there are lots of different ways of gathering this data, and I hope this blog post has at least encouraged you to look a little bit beyond the streetlight.\n\n_Thanks to [Thomas Steiner](https://blog.tomayac.com/) and [Jake Archibald](https://jakearchibald.com/) for feedback on a draft of this blog post._\n\n### _Related_\n\n[The cost of small modules](https://nolanlawson.com/2016/08/15/the-cost-of-small-modules/ \"The cost of small modules\")August 15, 2016In \"performance\"\n\n[Rebuilding emoji-picker-element on a custom framework](https://nolanlawson.com/2023/12/17/rebuilding-emoji-picker-element-on-a-custom-framework/ \"Rebuilding emoji-picker-element on a custom framework\")December 17, 2023In \"performance\"\n\n[Introducing emoji-picker-element: a memory-efficient emoji picker for the web](https://nolanlawson.com/2020/06/28/introducing-emoji-picker-element-a-memory-efficient-emoji-picker-for-the-web/ \"Introducing emoji-picker-element: a memory-efficient emoji picker for the web\")June 28, 2020In \"performance\"\n\n### 8 responses to this post.\n\n1. Posted by [JavaScript performance beyond bundle size – Full-Stack Feed](https://fullstackfeed.com/javascript-performance-beyond-bundle-size/) on [February 23, 2021 at 9:31 AM](https://nolanlawson.com/2021/02/23/javascript-performance-beyond-bundle-size/#comment-205692)\n\n\n\n\n\n\n\n\\[…\\] There’s an old story about a drunk trying to find his keys in the streetlight. Why? Well, because that’s where it’s the brightest. It’s a funny story, but also relatable, be… Read more \\[…\\]\n\n\n\n[Reply](https://nolanlawson.com/2021/02/23/javascript-performance-beyond-bundle-size/?replytocom=205692#respond)\n\n2. Posted by [Tomáš's webnest:](https://nest.jakl.one/likes/2021-02-24-9xmvn/) on [February 24, 2021 at 2:08 AM](https://nolanlawson.com/2021/02/23/javascript-performance-beyond-bundle-size/#comment-205711)\n\n\n\n\n\n\n\n\\[…\\] Liked [https://nolanlawson.com/2021/02/23/javascript-performance-beyond-bundle-size/](https://nolanlawson.com/2021/02/23/javascript-performance-beyond-bundle-size/) \\[…\\]\n\n\n\n[Reply](https://nolanlawson.com/2021/02/23/javascript-performance-beyond-bundle-size/?replytocom=205711#respond)\n\n3. \n\n\n\n\n\nPosted by Kiran K on [February 26, 2021 at 9:57 AM](https://nolanlawson.com/2021/02/23/javascript-performance-beyond-bundle-size/#comment-205761)\n\n\n\n\n\n\n\nAn awesome article. Thanks a lot.\n\n\n\n[Reply](https://nolanlawson.com/2021/02/23/javascript-performance-beyond-bundle-size/?replytocom=205761#respond)\n\n4. Posted by [JavaScript performance beyond bundle size – Bram.us](https://www.bram.us/2021/02/27/javascript-performance-beyond-bundle-size/) on [February 26, 2021 at 4:04 PM](https://nolanlawson.com/2021/02/23/javascript-performance-beyond-bundle-size/#comment-205768)\n\n\n\n\n\n\n\n\\[…\\] JavaScript performance beyond bundle size → \\[…\\]\n\n\n\n[Reply](https://nolanlawson.com/2021/02/23/javascript-performance-beyond-bundle-size/?replytocom=205768#respond)\n\n5. Posted by [Nolan Lawson: “JavaScript performance beyond bundle size” - Nicolas Hoizey](https://nicolas-hoizey.com/links/2021/03/08/javascript-performance-beyond-bundle-size/) on [March 8, 2021 at 7:04 AM](https://nolanlawson.com/2021/02/23/javascript-performance-beyond-bundle-size/#comment-206019)\n\n\n\n\n\n\n\n\\[…\\] [https://nolanlawson.com/2021/02/23/javascript-performance-beyond-bundle-size/](https://nolanlawson.com/2021/02/23/javascript-performance-beyond-bundle-size/) \\[…\\]\n\n\n\n[Reply](https://nolanlawson.com/2021/02/23/javascript-performance-beyond-bundle-size/?replytocom=206019#respond)\n\n6. \n\n\n\n\n\nPosted by [Why it’s okay for web components to use frameworks \\| Read the Tea Leaves](https://nolanlawson.com/2021/08/01/why-its-okay-for-web-components-to-use-frameworks/) on [August 1, 2021 at 10:55 AM](https://nolanlawson.com/2021/02/23/javascript-performance-beyond-bundle-size/#comment-210478)\n\n\n\n\n\n\n\n\\[…\\] « JavaScript performance beyond bundle size \\[…\\]\n\n\n\n[Reply](https://nolanlawson.com/2021/02/23/javascript-performance-beyond-bundle-size/?replytocom=210478#respond)\n\n7. Posted by [JavaScript News and Updates of March 2021](https://tuts.dizzycoding.com/javascript-news-and-updates-of-march-2021/) on [January 19, 2022 at 9:04 AM](https://nolanlawson.com/2021/02/23/javascript-performance-beyond-bundle-size/#comment-217680)\n\n\n\n\n\n\n\n\\[…\\] on performance rates such as parsing time, execution time, memory usage, etc. This insightful article explores this topic in great \\[…\\]\n\n\n\n[Reply](https://nolanlawson.com/2021/02/23/javascript-performance-beyond-bundle-size/?replytocom=217680#respond)\n\n8. Posted by [React Server Components: the Good, the Bad, and the Ugly](https://www.mayank.co/blog/react-server-components/) on [January 19, 2024 at 5:01 AM](https://nolanlawson.com/2021/02/23/javascript-performance-beyond-bundle-size/#comment-237488)\n\n\n\n\n\n\n\n\\[…\\] at a baseline of around ~70KB, Nuxt at ~60KB, SvelteKit at ~30KB, and Fresh at ~10KB. Of course, bundle cost isn’t everything, and some frameworks have a higher per-component cost that might reach an “inflection point” on \\[…\\]\n\n\n\n[Reply](https://nolanlawson.com/2021/02/23/javascript-performance-beyond-bundle-size/?replytocom=237488#respond)\n\n\n### Leave a comment [Cancel reply](https://nolanlawson.com/2021/02/23/javascript-performance-beyond-bundle-size/\\#respond)\n\nΔ\n\nThis site uses Akismet to reduce spam. [Learn how your comment data is processed.](https://akismet.com/privacy/)\n\n- [Comment](https://nolanlawson.com/2021/02/23/javascript-performance-beyond-bundle-size/#comments)\n- [Reblog](https://nolanlawson.com/2021/02/23/javascript-performance-beyond-bundle-size/)\n- [Subscribe](https://nolanlawson.com/2021/02/23/javascript-performance-beyond-bundle-size/) [Subscribed](https://nolanlawson.com/2021/02/23/javascript-performance-beyond-bundle-size/)\n\n\n\n\n\n\n\n\n - [ Read the Tea Leaves](https://nolanlawson.com/)\n\nJoin 1,336 other subscribers\n\nSign me up\n\n - Already have a WordPress.com account? [Log in now.](https://wordpress.com/log-in?redirect_to=https%3A%2F%2Fr-login.wordpress.com%2Fremote-login.php%3Faction%3Dlink%26back%3Dhttps%253A%252F%252Fnolanlawson.com%252F2021%252F02%252F23%252Fjavascript-performance-beyond-bundle-size%252F)\n\n\n- - [ Read the Tea Leaves](https://nolanlawson.com/)\n - [Subscribe](https://nolanlawson.com/2021/02/23/javascript-performance-beyond-bundle-size/) [Subscribed](https://nolanlawson.com/2021/02/23/javascript-performance-beyond-bundle-size/)\n - [Sign up](https://wordpress.com/start/)\n - [Log in](https://wordpress.com/log-in?redirect_to=https%3A%2F%2Fr-login.wordpress.com%2Fremote-login.php%3Faction%3Dlink%26back%3Dhttps%253A%252F%252Fnolanlawson.com%252F2021%252F02%252F23%252Fjavascript-performance-beyond-bundle-size%252F)\n - [Copy shortlink](https://wp.me/p1t8Ca-2sm)\n - [Report this content](https://wordpress.com/abuse/?report_url=https://nolanlawson.com/2021/02/23/javascript-performance-beyond-bundle-size/)\n - [View post in Reader](https://wordpress.com/reader/blogs/21720966/posts/9446)\n - [Manage subscriptions](https://subscribe.wordpress.com/)\n - [Collapse this bar](https://nolanlawson.com/2021/02/23/javascript-performance-beyond-bundle-size/)\n\n[Toggle photo metadata visibility](https://nolanlawson.com/2021/02/23/javascript-performance-beyond-bundle-size/#)[Toggle photo comments visibility](https://nolanlawson.com/2021/02/23/javascript-performance-beyond-bundle-size/#)\n\nLoading Comments...\n\nWrite a Comment...\n\nEmail (Required)Name (Required)Website","metadata":{"ogUrl":"https://nolanlawson.com/2021/02/23/javascript-performance-beyond-bundle-size/","generator":"WordPress.com","ogImage":"https://i0.wp.com/nolanlawson.com/wp-content/uploads/2021/02/screenshot-from-2021-02-20-09-45-39.png?fit=1200%2C479&ssl=1","publishedTime":"2021-02-23T16:38:22+00:00","article:publisher":"https://www.facebook.com/WordPresscom","robots":"max-image-preview:large","og:title":"JavaScript performance beyond bundle size","og:locale":"en_US","og:site_name":"Read the Tea Leaves","twitter:image":"https://i0.wp.com/nolanlawson.com/wp-content/uploads/2021/02/screenshot-from-2021-02-20-09-45-39.png?fit=1200%2C479&ssl=1&w=640","ogDescription":"There’s an old story about a drunk trying to find his keys in the streetlight. Why? Well, because that’s where it’s the brightest. It’s a funny story, but also relatable, be…","og:image:alt":"Screenshot of Webpack Bundle Analyer showing a list of modules and sizes on the left and a visual tree map of modules and sizes on the right, where the module is larger if it has a greater size, and modules-within-modules are also shown proportionally","article:published_time":"2021-02-23T16:38:22+00:00","msapplication-TileImage":"https://nolanlawson.com/wp-content/uploads/2025/01/favicon.png?w=32","bilmur:data":"","ogSiteName":"Read the Tea Leaves","twitter:text:title":"JavaScript performance beyond bundle size","title":"JavaScript performance beyond bundle size | Read the Tea Leaves","og:url":"https://nolanlawson.com/2021/02/23/javascript-performance-beyond-bundle-size/","language":"en","twitter:image:alt":"Screenshot of Webpack Bundle Analyer showing a list of modules and sizes on the left and a visual tree map of modules and sizes on the right, where the module is larger if it has a greater size, and modules-within-modules are also shown proportionally","twitter:card":"summary_large_image","article:modified_time":"2021-02-23T18:28:39+00:00","og:description":"There’s an old story about a drunk trying to find his keys in the streetlight. Why? Well, because that’s where it’s the brightest. It’s a funny story, but also relatable, be…","og:type":"article","ogTitle":"JavaScript performance beyond bundle size","ogLocale":"en_US","og:image:height":"479","modifiedTime":"2021-02-23T18:28:39+00:00","og:image:width":"1200","og:image":"https://i0.wp.com/nolanlawson.com/wp-content/uploads/2021/02/screenshot-from-2021-02-20-09-45-39.png?fit=1200%2C479&ssl=1","description":"There's an old story about a drunk trying to find his keys in the streetlight. Why? Well, because that's where it's the brightest. It's a funny story, but also relatable, because as humans we all tend to take the path of least resistance. I think we have the same problem in the web performance community.…","favicon":"https://nolanlawson.com/wp-content/uploads/2025/01/favicon.png?w=32","scrapeId":"019d3958-259f-74ed-8ae7-fac4de15f854","sourceURL":"https://nolanlawson.com/2021/02/23/javascript-performance-beyond-bundle-size/","url":"https://nolanlawson.com/2021/02/23/javascript-performance-beyond-bundle-size/","statusCode":200,"contentType":"text/html; charset=UTF-8","timezone":"America/New_York","proxyUsed":"basic","cacheState":"miss","indexId":"f0dc4ff5-498a-40e2-b945-f8e0f0a53862","creditsUsed":1}},{"url":"https://dev.to/dzakh/javascript-schema-library-from-the-future-5420","title":"JavaScript schema library from the Future - DEV Community","description":"To maximize DX, performance, and bundle size while keeping the library fully runtime, I've decided to use eval under the hood. You needn't worry ...","position":3,"markdown":"[ReScript Schema](https://github.com/DZakh/rescript-schema) \\- The fastest parser in the entire JavaScript ecosystem with a focus on small bundle size and top-notch DX.\n\nWhy did you not hear about it then, and why should you learn about it now? I started developing the library three years ago, and today, it's at a point others have yet to achieve. I'll prove it in the article, but before we start, I'd like to answer a few questions you might already have.\n\n### What's a parser?\n\nOne of the most basic applications of ReScript Schema is parsing - Accepting unknown JavaScript data, validating it, and returning the result of your desired type. There are dozens of such libraries, and the most popular ones are [Zod](https://github.com/colinhacks/zod), [Valibot](https://github.com/fabian-hiller/valibot), [Runtypes](https://github.com/runtypes/runtypes), [Arktype](https://github.com/arktypeio/arktype), [Typia](https://github.com/samchon/typia), [Superstruct](https://github.com/ianstormtaylor/superstruct), [Effect Schema](https://github.com/Effect-TS/schema), and more. Also, even though this is slightly different, validation libraries like [Ajv](https://github.com/ajv-validator/ajv), [Yup](https://github.com/jquense/yup), and others also stand really close.\n\n### Is ReScript Schema faster than all of them?\n\nYes. It's ~100 times faster than [Zod](https://github.com/colinhacks/zod) and on par with [Typia](https://github.com/samchon/typia) or [Arktype](https://github.com/arktypeio/arktype) ( [benchmark](https://moltar.github.io/typescript-runtime-type-benchmarks/)). But often, besides validation, you want to transform data incoming to your system, and here, ReScript Schema overperforms any solution existing in the JavaScript ecosystem.\n\n### What's ReScript? Isn't the library for JavaScript/TypeScript?\n\n[ReScript](https://rescript-lang.org/) is a robustly typed language that compiles to efficient and human-readable JavaScript. And yes, ReScript Schema is written in ReScript, but it also has a really nice JavaScript API with TS types. You don't need to install or run any compiler; `npm i rescript-schema` is all you need.\n\nIt makes ReScript Schema support 3 languages - JavaScript, TypeScript, and ReScript. This is especially nice when you mix TypeScript and ReScript in a single codebase 👌\n\n### Are there trade-offs?\n\nYes. To maximize DX, performance, and bundle size while keeping the library fully runtime, I've decided to use [eval](https://developer.mozilla.org/en-US/docs/Web/JavaScript/Reference/Global_Objects/eval) under the hood. You needn't worry about the code's dangerous execution, but some environments, like Cloudflare Workers, won't work. In 99% of cases, you don't need to be concerned about this. I just think it's my duty as a creator to let you know about the 1% beforehand.\n\n### What's the plan?\n\nI'm going to provide an overview of the basic ReScript Schema API and mental model. Then, we'll discuss what makes it stand out from millions of similar libraries (and this is not only performance). I'll also look at some more advanced use cases and discuss the ecosystem, performance, and where it stands with other libraries.\n\nI hope you'll enjoy it. 😊\n\n> Follow me on [X](https://x.com/dzakh_dev) to learn more about programming stuff I'm cooking.\n\n## Parsing / Validating\n\nLet's start with the most basic use case of ReScript Schema. By the way, if you don't know the difference between parsing (sometimes called decoding) and validating, here's a [good article](https://lexi-lambda.github.io/blog/2019/11/05/parse-don-t-validate/) from Zod's docs. If you're curious about when and why you need to parse data in your application, let me know in the comments. I can write a big article about it, but for now, I assume you are already familiar with the concept.\n\nLet's finally take a look at the code. I'll go with the TypeScript example first, so it's more familiar for most readers. Everything starts with defining a schema of the data you expect:\n\n```\nimport * as S from \"rescript-schema\";\n\nconst filmSchema = S.schema({\n id: S.number,\n title: S.string,\n tags: S.array(S.string),\n rating: S.union([\"G\", \"PG\", \"PG13\", \"R\"])\n})\n```\n\nEnter fullscreen modeExit fullscreen mode\n\nThe schema here is like a type definition that exists in runtime. If you hover over the `filmSchema`, you'll see the following type:\n\n```\nS.Schema<{\n id: number;\n title: string;\n tags: string[];\n rating: \"G\" | \"PG\" | \"PG13\" | \"R\";\n}>\n```\n\nEnter fullscreen modeExit fullscreen mode\n\nThis is a `Schema` type that inferred the film object definition. I recommend extracting its value into its own type. This way, you'll have the schema as the source of truth and the `Film` type always matching the schema:\n\n```\ntype Film = S.Output\n```\n\nEnter fullscreen modeExit fullscreen mode\n\nAfter we've defined our `Film` type using the schema, we can parse unknown data entering our application to guarantee that it matches what we expect:\n\n```\nS.parseOrThrow(\n {\n id: 1,\n title: \"My first film\",\n tags: [\"Loved\"],\n rating: \"S\",\n },\n filmSchema,\n);\n//? Throws RescriptSchemaError with message `Failed parsing at [\"rating\"]. Reason: Expected \"G\" | \"PG\" | \"PG13\" | \"R\", received \"S\"`\n\nS.parseOrThrow(validDataWithUnknownType, filmSchema)\n//? Returns value of the Film type\n\n// If you don't want to throw, you can wrap the operations in S.safe and get S.Result as a return value\nS.safe(() => S.parseOrThrow(data, filmSchema))\n```\n\nEnter fullscreen modeExit fullscreen mode\n\nDone! We have valid data here 🙌\n\nSome experienced users may have noticed that the API is similar to [Valibot](https://github.com/fabian-hiller/valibot), but with a unique flavor.\n\nYou can use `S.schema` for objects, tuples, and literals. For any kind of union, there's `S.union`; even if it's a [discriminated](https://github.com/DZakh/rescript-schema/blob/main/docs/js-usage.md#discriminated-unions) one, the parser will perform in the most optimized way. I personally have seen this kind of DX only in [ArkType](https://arktype.io/) so far.\n\nAlso, there are no annoying parentheses; the parse function explicitly says it can throw, and thanks to the modular design, the library tree-shaking is very good.\n\n### Package size\n\nSince I mentioned tree-shaking, I'd like to quickly note about the package size. The bundle size is an essential metric for a web application, and I'd like to share how ReScript Schema is doing here in comparison with other libraries:\n\n| | [rescript-schema@9.2.2](mailto:rescript-schema@9.2.2) | [Zod@3.24.1](mailto:Zod@3.24.1) | [Valibot@1.0.0-beta.14](mailto:Valibot@1.0.0-beta.14) | [ArkType@2.0.4](mailto:ArkType@2.0.4) |\n| --- | --- | --- | --- | --- |\n| **Total size** (minified + gzipped) | 12.7 kB | 15.2 kB | 12.3 kB | 40.8 kB |\n| **Example size** (minified + gzipped) | 5.14 kB | 14.5 kB | 1.39 kB | 40.7 kB |\n| **Playground** | [Link](https://bundlejs.com/?q=rescript-schema%409.2.2&treeshake=%5B*%5D&text=%22const+filmSchema+%3D+S.schema%28%7B%5Cn++id%3A+S.number%2C%5Cn++title%3A+S.string%2C%5Cn++tags%3A+S.array%28S.string%29%2C%5Cn++rating%3A+S.union%28%5B%5C%22G%5C%22%2C+%5C%22PG%5C%22%2C+%5C%22PG13%5C%22%2C+%5C%22R%5C%22%5D%29%2C%5Cn%7D%29%3B%5Cn%5CnS.parseOrThrow%28null%2C+filmSchema%29%22) | [Link](https://bundlejs.com/?q=zod%403.24.1&treeshake=%5B*%5D&text=%22const+filmSchema+%3D+z.object%28%7B%5Cn++id%3A+z.number%28%29%2C%5Cn++title%3A+z.string%28%29%2C%5Cn++tags%3A+z.array%28z.string%28%29%29%2C%5Cn++rating%3A+z.enum%28%5B%5C%22G%5C%22%2C+%5C%22PG%5C%22%2C+%5C%22PG13%5C%22%2C+%5C%22R%5C%22%5D%29%2C%5Cn%7D%29%3B%5Cn%5CnfilmSchema.parse%28null%29%22) | [Link](https://bundlejs.com/?q=valibot%401.0.0-beta.14&treeshake=%5B*%5D&text=%22const+filmSchema+%3D+v.object%28%7B%5Cn++id%3A+v.number%28%29%2C%5Cn++title%3A+v.string%28%29%2C%5Cn++tags%3A+v.array%28z.string%28%29%29%2C%5Cn++rating%3A+v.picklist%28%5B%5C%22G%5C%22%2C+%5C%22PG%5C%22%2C+%5C%22PG13%5C%22%2C+%5C%22R%5C%22%5D%29%2C%5Cn%7D%29%3B%5Cn%5Cnv.parse%28filmSchema%2C+null%29%22) | [Link](https://bundlejs.com/?q=arktype%402.0.4&treeshake=%5B*%5D&text=%22const+filmSchema+%3D+type%28%7B%5Cn++id%3A+%5C%22number%5C%22%2C%5Cn++title%3A+%5C%22string%5C%22%2C%5Cn++tags%3A+%5C%22string%5B%5D%5C%22%2C%5Cn++rating%3A+%60%5C%22G%5C%22+%7C+%5C%22PG%5C%22+%7C+%5C%22PG13%5C%22+%7C+%5C%22R%5C%22%60%2C%5Cn%7D%29%3B%5Cn%5CnfilmSchema%28null%29%22) |\n\nIt's not as amazing as Valibot, but ReScript Schema is definitely doing good here. If we compare ReScript Schema to libraries that have similar performance, they all use the code generation approach (besides ArkType). This means it'll start small, but for every new type, more and more code will be added to your bundle, rapidly increasing the application size.\n\n### Parsing using ReScript\n\nEven though I want to make ReScript Schema popular for TS developers, ReScript is still the library's main user base, so I'll also include examples of it.\n\nCompared to TypeScript, the type system in ReScript is much simpler; you literally can't do any type gymnastics in it. Together with [nominal typing](https://medium.com/@thejameskyle/type-systems-structural-vs-nominal-typing-explained-56511dd969f4), it's getting impossible to extract the `film` type from the schema (even though it can infer it). But there's a built-in way to prevent boilerplate code in ReScript. You can use ReScript Schema PPX to generate schemas for your types automatically. Just annotate them with `@schema` attribute.\n\n```\n@schema\ntype rating =\n | @as(\"G\") GeneralAudiences\n | @as(\"PG\") ParentalGuidanceSuggested\n | @as(\"PG13\") ParentalStronglyCautioned\n | @as(\"R\") Restricted\n@schema\ntype film = {\n id: float,\n title: string,\n tags: array,\n rating: rating,\n}\n```\n\nEnter fullscreen modeExit fullscreen mode\n\nDoes the `rating` type look scary to you? Don't worry, this is a ReScript [Variant](https://rescript-lang.org/docs/manual/v11.0.0/variant), which is such a nice way to describe any kind of union. Also, you can use `@as` and give a better name to the ratings while preserving the original short values in runtime.\n\nAlthough PPX is nice, you can always code without it:\n\n```\ntype rating =\n | @as(\"G\") GeneralAudiences\n | @as(\"PG\") ParentalGuidanceSuggested\n | @as(\"PG13\") ParentalStronglyCautioned\n | @as(\"R\") Restricted\ntype film = {\n id: float,\n title: string,\n tags: array,\n rating: rating,\n}\n\nlet filmSchema = S.schema(s => {\n id: s.matches(S.number),\n title: s.matches(S.string),\n tags: s.matches(S.array(S.string)),\n rating: s.matches(S.union([\\\n GeneralAudiences,\\\n ParentalGuidanceSuggested,\\\n ParentalStronglyCautioned,\\\n Restricted\\\n ]))\n})\n```\n\nEnter fullscreen modeExit fullscreen mode\n\nThe TS API admittedly wins here since we don't need to call `s.matches` to make type system happy, but when it comes to parsing ReScript takes it back with the [Pipe Operator](https://rescript-lang.org/docs/manual/v11.0.0/pipe) and [Pattern Matching on exceptions](https://rescript-lang.org/docs/manual/v11.0.0/pattern-matching-destructuring#match-on-exceptions):\n\n```\n{\n \"id\": 1,\n \"title\": \"My first film\",\n \"tags\": [\"Loved\"],\n \"rating\": \"S\",\n}->S.parseOrThrow(filmSchema)\n//? Throws RescriptSchemaError with message `Failed parsing at [\"rating\"]. Reason: Expected \"G\" | \"PG\" | \"PG13\" | \"R\", received \"S\"`\n\nvalidDataWithUnknownType->S.parseOrThrow(filmSchema)\n//? Returns value of the film type\n\n// If you don't want to throw, you can match on the S.Raised exception and return the result type. There's no S.safe API like in TypeScript, since you can do better with the language itself!\nswitch data->S.parseOrThrow(filmSchema) {\n| film => Ok(film)\n| exception S.Raised(error) => Error(error)\n}\n```\n\nEnter fullscreen modeExit fullscreen mode\n\n## Unique Features\n\nAfter we covered the most basic use case, let's move on to the things that make ReScript Schema special 🔥\n\n### Changing shape and field names\n\nLet's imagine working with a weird REST API with poorly named fields in PascalCase, where data is randomly nested in objects or tuples. But we can't change the backend, so at least we want to transform data to a more convenient format for our application. In ReScript Schema you can make it in a declarative way, which will result in the most possibly performant operation:\n\n```\nconst filmSchema = S.object((s) => ({\n id: s.field(\"Id\", S.number),\n title: s.nested(\"Meta\").field(\"Title\", S.string),\n tags: s.field(\"Tags_v2\", S.array(S.string)),\n rating: s.field(\"Rating\", S.schema([S.union([\"G\", \"PG\", \"PG13\", \"R\"])]))[0],\n}));\n\nS.parseOrThrow(\n {\n Id: 1,\n Meta: {\n Title: \"My first film\",\n },\n Tags_v2: [\"Loved\"],\n Rating: [\"G\"],\n },\n filmSchema\n);\n//? { id: 1, title: \"My first film\", tags: [\"Loved\"], rating: \"G\" }\n```\n\nEnter fullscreen modeExit fullscreen mode\n\nLooks scary? Let's dive in. First of all, every schema has `Input` and `Output`. Quite often, they are equal, and during parsing, the library only validates that `Input` has the correct type and returns it immediately. Although there are ways to change the expected `Output` type like we do in the example above. For comparison, let's take a look at how you'd usually achieve the same with other schema libraries:\n\n```\nconst filmSchema = S.transform(\n S.schema({\n Id: S.number,\n Meta: {\n Title: S.string,\n },\n Tags_v2: S.array(S.string),\n Rating: S.schema([S.union([\"G\", \"PG\", \"PG13\", \"R\"])]),\n }),\n (input) => ({\n id: input.Id,\n title: input.Meta.Title,\n tags: input.Tags_v2,\n rating: input.Rating[0],\n })\n);\n```\n\nEnter fullscreen modeExit fullscreen mode\n\nThis is still ReScript Schema, but we use `S.transform` to manually transform the `Input` type. You can find this kind of API in many other schema libraries. What's good about the example is that you can clearly see that we use our schema to declaratively describe what the data incoming to our system looks like, and then we transform it to what's convenient for us to work with. In a way, the schema here is similar to a contract between the client and the server that returns the object in response.\n\nIn the advanced `S.object` example, which I showed first, we combine a declarative description of the `Input` type with a transformation to the `Output` type. And this enables one more thing besides shorter code and a performance boost.\n\n### Reverse Parsing (aka serializing/decoding)\n\nDecoding is present in many libraries from other languages, but it's not very common in the JS ecosystem. This is a big loss because the ability to perform operations in the reverse direction is the most powerful feature I personally find.\n\nIf it's unclear what I mean, in other popular JavaScript schema libraries, you can only parse `Input` to `Output` types. While in ReScript Schema you can easily parse `Output` to `Input` using the same schema. Or only perform the conversion logic since the `Output` type usually doesn't require validation.\n\nDo you remember our `filmSchema` using `S.object` to rename fields? Let's say we want to send a POST request with the film entity, and the server also expects the weirdly cased data structure it initially sent to us. Here is how we deal with it:\n\n```\n// The same schema from above\nconst filmSchema = S.object((s) => ({\n id: s.field(\"Id\", S.number),\n title: s.nested(\"Meta\").field(\"Title\", S.string),\n tags: s.field(\"Tags_v2\", S.array(S.string)),\n rating: s.field(\"Rating\", S.schema([S.union([\"G\", \"PG\", \"PG13\", \"R\"])]))[0],\n}));\n\nS.reverseConvertOrThrow({ id: 1, title: \"My first film\", tags: [\"Loved\"], rating: \"G\" }, filmSchema)\n//? { Id: 1, Meta: { Title: \"My first film\" }, Tags_v2: [\"Loved\"], Rating: [\"G\"] }\n```\n\nEnter fullscreen modeExit fullscreen mode\n\nSweet! Isn't it? And even though I want to talk more about performance a little bit later, I can't stop myself from sharing the code it evaluates under the hood:\n\n```\n(i) => {\n let v0 = i[\"tags\"];\n return {\n Id: i[\"id\"],\n Meta: { Title: i[\"title\"] },\n Tags_v2: v0,\n Rating: [i[\"rating\"]],\n };\n};\n```\n\nEnter fullscreen modeExit fullscreen mode\n\nI think most people would write slower code by hand 😅\n\n### Reverse\n\nThe `S.reverseConvertOrThrow` is one of the reverse cases I use daily in my work, but this is actually just a shorthand of `S.convertOrThrow` and `S.reverse` you can use separately.\n\n`S.reverse` \\- this is what allows you to take your `Schema` and turn it into `Schema`.\n\nIt may sound quite dull, but compared to the commonly used parser/serializer or encoder/decoder approach, here you get an actual schema you can use the same way as the original one without any limitations.\n\nIf you want, you can parse output with/without data validation, generate JSON Schema, perform optimized comparison and hashing, or use the data representation in runtime for any custom logic.\n\nAs a fruit of the ability to know `Input` and `Output` data types in runtime, ReScript Schema has a very powerful coercion API.\n\n```\nconst schema = S.coerce(S.string, S.bigint)\nS.parseOrThrow(\"123\", schema) //? 123n\nS.reverseConvertOrThrow(123n, schema) //? \"123\"\n```\n\nEnter fullscreen modeExit fullscreen mode\n\nPass any schemas to `S.coerce` that you want to coerce from and to, and ReScript Schema will figure out the rest.\n\nAnd this has not been implemented yet, but with the API, it'll also be possible to achieve 2x faster JSON.stringify(). Like [fast-json-stringify](https://github.com/fastify/fast-json-stringify) does and maybe even faster 😎\n\n### 100 Operations\n\nIf you want the best possible performance or the built-in operations don't cover your specific use case, you can use `S.compile` to create fine-tuned operation functions.\n\n```\nconst operation = S.compile(S.string, \"Any\", \"Assert\", \"Async\");\n//? (input: unknown) => Promise\n\nawait operation(\"Hello world!\");\n```\n\nEnter fullscreen modeExit fullscreen mode\n\nIn the example above, we've created an async assert operation, which is not available by default.\n\nWith the API, you can get 100 different operation combinations, each of which might make sense for your specific use case. This is like [parser](https://valibot.dev/api/parser/) in Valibot, but multiplied by 💯.\n\n### Performance Comparison\n\nAs I mentioned in the beginning, ReScript Schema is the fastest. Now I'll explain why 🔥\n\nAlso, you can use the big community [benchmark](https://moltar.github.io/typescript-runtime-type-benchmarks/) to confirm yourself. If you see [Typia](https://typia.io/) overperforming ReScript Schema, I have a take on it too 😁\n\nFirst of all, the biggest advantage of ReScript Schema is its very clever library core, which builds the most possibly optimized operations using `eval`. I have already shown before how the operation code looks for reverse conversion; here's the `filmSchema` parse operation code:\n\n```\n(i) => {\n if (typeof i !== \"object\" || !i) {\n e[7](i);\n }\n let v0 = i[\"Id\"],\n v1 = i[\"Meta\"],\n v3 = i[\"Tags_v2\"],\n v7 = i[\"Rating\"];\n if (typeof v0 !== \"number\" || Number.isNaN(v0)) {\n e[0](v0);\n }\n if (typeof v1 !== \"object\" || !v1) {\n e[1](v1);\n }\n let v2 = v1[\"Title\"];\n if (typeof v2 !== \"string\") {\n e[2](v2);\n }\n if (!Array.isArray(v3)) {\n e[3](v3);\n }\n for (let v4 = 0; v4 < v3.length; ++v4) {\n let v6 = v3[v4];\n try {\n if (typeof v6 !== \"string\") {\n e[4](v6);\n }\n } catch (v5) {\n if (v5 && v5.s === s) {\n v5.path = '[\"Tags_v2\"]' + '[\"' + v4 + '\"]' + v5.path;\n }\n throw v5;\n }\n }\n if (!Array.isArray(v7) || v7.length !== 1) {\n e[5](v7);\n }\n let v8 = v7[\"0\"];\n if (v8 !== \"G\") {\n if (v8 !== \"PG\") {\n if (v8 !== \"PG13\") {\n if (v8 !== \"R\") {\n e[6](v8);\n }\n }\n }\n }\n return { id: v0, title: v2, tags: v3, rating: v8 };\n};\n```\n\nEnter fullscreen modeExit fullscreen mode\n\nThanks to `eval`, we can eliminate function calls and inline all type validations using `if` statements. Also, knowing about the `Output` type at runtime allows us to perform transformations with zero wasteful object allocations, optimizing the operation for JavaScript engines.\n\nInterestingly, you probably think that calling `eval` itself is slow, and I thought this myself. However, it was actually not as slow as I expected. For example, creating a simple nested object schema and calling the parser once happened to be 1.8 times faster with ReScript Schema using eval than Zod. I really put a lot of effort into making it as fast as possible, and I have to thank the [ReScript language](https://rescript-lang.org/) and the people behind it for allowing me to write very performant and safe code.\n\nTalking about [ArkType](https://arktype.io/), they use the same approach with eval and have similar potential to ReScript Schema, but their evaluated code is not there yet. Currently, their operations are a little bit slower, and the schema creation is significantly slower. But I can see that it can somewhat catch up in the future.\n\nWhat other libraries will never be able to catch up on is the ability to reshape schema declaratively. And this is why I say that ReScript Schema is faster than Typia. Also, Typia doesn't always generate the most optimized code, e.g., for optional fields. And it doesn't come with many built-in operations specifically optimized for the desired use case. Still, this is an excellent library with Fast JSON Serialization and Protocol Buffer Encoding features, which I'm still yet to implement.\n\n### Ecosystem\n\nWhen choosing a schema library for your project, where performance is not a concern, the ecosystem is the most important factor to consider. With a schema, you can do millions of things by knowing the type of representation in runtime. Such as JSON Schema generation, describing database schemas, optimized comparison and hashing, encoding to proto buff, building forms, mocking data, communicating with AI, and much more.\n\nZod is definitely a winner here. I counted 78 libraries integrating with Zod at the moment of writing the article. There are even some where you provide a Zod schema, and it renders a Vue page with a form prompting for the data. This is just too convenient for not using it for prototyping.\n\nBut if you don't need something super specific, ReScript Schema has a decent ecosystem itself, which is comparable to Valibot and ArkType. Actually, it has an even higher potential thanks to the ability to adjust Shape and automatically Reverse the schema. A good example of this is [ReScript Rest](https://github.com/DZakh/rescript-rest), which combines the DX of [tRPC](https://trpc.io/) while staying unopinionated like [ts-rest](https://ts-rest.com/). I also built many powerful tools around ReScript Schema, but I have to admit that I haven't added TS support yet. Let me know if you find something interesting to use, and I'll do this asap 😁\n\nAlso, ReScript Schema supports [Standard Schema](https://standardschema.dev/), a common interface for TypeScript validation libraries. It was recently designed by the creators of Zod, Valibot, and ArkType and has already been integrated into many popular libraries. This means that you can use ReScript Schema with [tRPC](https://trpc.io/), [TanStack Form](https://tanstack.com/form), [TanStack Router](https://tanstack.com/router), [Hono](https://hono.dev/), and 19+ more at the time of writing the article.\n\n### Conclusion\n\nAs the title says, I wholeheartedly believe that ReScript Schema is the future of schema libraries. It offers both DX, performance, bundle size, and many innovative features. I tried to cover all of them at a high level, and I hope I managed to make you at least a little bit interested 👌\n\nI don't persuade you to choose ReScript Schema for your next project, and I actually still recommend Zod when somebody asks me. But I'll definitely appreciate a [star](https://github.com/DZakh/rescript-schema) and [X follow](https://x.com/dzakh_dev) 🙏\n\nLet's see how the future of schema libraries will turn out. Maybe I'll rename ReScript Schema to something dope and become more popular than Zod? Cheers 😁\n\n[\\\\\nMongoDB](https://dev.to/mongodb) Promoted\n\nDropdown menu\n\n- [What's a billboard?](https://dev.to/billboards)\n- [Manage preferences](https://dev.to/settings/customization#sponsors)\n\n* * *\n\n- [Report billboard](https://dev.to/report-abuse?billboard=241241)\n\n[](https://www.mongodb.com/cloud/atlas/lp/try3?utm_campaign=display_devto-broad_pl_flighted_atlas_tryatlaslp_prosp_gic-null_ww-all_dev_dv-all_eng_leadgen&utm_source=devto&utm_medium=display&utm_content=airevolution-v1&bb=241241)\n\n## [Gen AI apps are built with MongoDB Atlas](https://www.mongodb.com/cloud/atlas/lp/try3?utm_campaign=display_devto-broad_pl_flighted_atlas_tryatlaslp_prosp_gic-null_ww-all_dev_dv-all_eng_leadgen&utm_source=devto&utm_medium=display&utm_content=airevolution-v1&bb=241241)\n\nMongoDB Atlas is the developer-friendly database for building, scaling, and running gen AI & LLM apps—no separate vector DB needed. Enjoy native vector search, 115+ regions, and flexible document modeling. Build AI faster, all in one place.\n\n[Start Free](https://www.mongodb.com/cloud/atlas/lp/try3?utm_campaign=display_devto-broad_pl_flighted_atlas_tryatlaslp_prosp_gic-null_ww-all_dev_dv-all_eng_leadgen&utm_source=devto&utm_medium=display&utm_content=airevolution-v1&bb=241241)\n\nRead More\n\n\n\n\n[Create template](https://dev.to/settings/response-templates)\n\nTemplates let you quickly answer FAQs or store snippets for re-use.\n\nSubmitPreview [Dismiss](https://dev.to/404.html)\n\nCollapseExpand\n\n[](https://dev.to/1ce)\n\n[Sby](https://dev.to/1ce)\n\nSby\n\n\n\n[\\\\\nSby](https://dev.to/1ce)\n\nFollow\n\nI write good code.\nInterested in moving to another country.\n\n\n- Joined\n\n\nNov 3, 2024\n\n\n• [Feb 22 '25](https://dev.to/dzakh/javascript-schema-library-from-the-future-5420#comment-2m16g)\n\nDropdown menu\n\n- [Copy link](https://dev.to/dzakh/javascript-schema-library-from-the-future-5420#comment-2m16g)\n- Hide\n\n- [Report abuse](https://dev.to/report-abuse?url=https://dev.to/1ce/comment/2m16g)\n\nNice work! Definitely will consider it next time I need a parser or a validator.\n\nBy the way, since you're familiar with Typia, have you by any chance seen a recent post by Typia's author about its performance with the Bun runtime being 20 times slower?\n\nWould you perhaps have any comments on that? I'm also interested in how ReScript Schema performs with different runtimes (Node, Deno, Bun, browser)\n\nCollapseExpand\n\n[](https://dev.to/dzakh)\n\n[Dmitry Zakharov](https://dev.to/dzakh)\n\nDmitry Zakharov\n\n\n\n[\\\\\nDmitry Zakharov](https://dev.to/dzakh)\n\nFollow\n\nBuild fastest tools with best DX 🫡\n\n\n- Location\n\n\n\nGeorgia, Batumi\n\n\n- Work\n\n\n\nEnvio\n\n\n- Joined\n\n\nDec 11, 2022\n\n\n• [Feb 23 '25](https://dev.to/dzakh/javascript-schema-library-from-the-future-5420#comment-2m19p)\n\nDropdown menu\n\n- [Copy link](https://dev.to/dzakh/javascript-schema-library-from-the-future-5420#comment-2m19p)\n- Hide\n\n- [Report abuse](https://dev.to/report-abuse?url=https://dev.to/dzakh/comment/2m19p)\n\nInteresting, this is a new one. Just read it and left a like [dev.to/samchon/bun-is-up-to-20x-sl...](https://dev.to/samchon/bun-is-up-to-20x-slower-than-nodejs-in-logic-operations-305d)\n\nNode.js, Deno and Browser are fine; the only problem is with Bun, which you can see in the community benchmark [moltar.github.io/typescript-runtim...](https://moltar.github.io/typescript-runtime-type-benchmarks)\n\nI can see many comments in the article where people claim that it's a Typia specific problem, but Typia is a codegen library, and it doesn't do anything special in runtime. This means if you write a function like `(input) => \"string\" === typeof input` by hand and run it multiple times, it'll execute multiple times slower in Bun than in any other runtime.\n\nCollapseExpand\n\n[](https://dev.to/retakenroots)\n\n[Rene Kootstra](https://dev.to/retakenroots)\n\nRene Kootstra\n\n\n\n[\\\\\nRene Kootstra](https://dev.to/retakenroots)\n\nFollow\n\nAuthor of enge-js a pure JavaScript playstation 1 emulator and professional developer for 25+ years.\n\n\n- Joined\n\n\nFeb 12, 2022\n\n\n• [Feb 23 '25](https://dev.to/dzakh/javascript-schema-library-from-the-future-5420#comment-2m1a7)\n\nDropdown menu\n\n- [Copy link](https://dev.to/dzakh/javascript-schema-library-from-the-future-5420#comment-2m1a7)\n- Hide\n\n- [Report abuse](https://dev.to/report-abuse?url=https://dev.to/retakenroots/comment/2m1a7)\n\nHmm very interesting article. Though when i read eval it raised some concerns. Nonetheless good job.\n\nCollapseExpand\n\n[](https://dev.to/dzakh)\n\n[Dmitry Zakharov](https://dev.to/dzakh)\n\nDmitry Zakharov\n\n\n\n[\\\\\nDmitry Zakharov](https://dev.to/dzakh)\n\nFollow\n\nBuild fastest tools with best DX 🫡\n\n\n- Location\n\n\n\nGeorgia, Batumi\n\n\n- Work\n\n\n\nEnvio\n\n\n- Joined\n\n\nDec 11, 2022\n\n\n• [Feb 23 '25](https://dev.to/dzakh/javascript-schema-library-from-the-future-5420#comment-2m1ac)\n\nDropdown menu\n\n- [Copy link](https://dev.to/dzakh/javascript-schema-library-from-the-future-5420#comment-2m1ac)\n- Hide\n\n- [Report abuse](https://dev.to/report-abuse?url=https://dev.to/dzakh/comment/2m1ac)\n\nIt's indeed good to be aware of this because if you build for serverless or some widget that is embedded as a CDN to someone else website ( [CSP](https://developer.mozilla.org/en-US/docs/Web/HTTP/CSP)) there might be problems. But as I said, this is ~1% of use cases.\n\nAlso, ArkType uses eval, and according to [Colin](https://x.com/colinhacks)'s words, he plans to add Eval mode to Zod v4.\n\nIdeally, there should be a fallback mode to be able to work without Eval when it's not supported. I actually recently got an idea of how to implement it without reducing the quality of the library. But it'll probably take several months for me to implement.\n\nCollapseExpand\n\n[](https://dev.to/dhruvgarg79)\n\n[Dhruv garg](https://dev.to/dhruvgarg79)\n\nDhruv garg\n\n\n\n[\\\\\nDhruv garg](https://dev.to/dhruvgarg79)\n\nFollow\n\nWorking as a Tech Lead at a MarTech Startup.\nInterested in Databases, Performance, and everything Backend.\n\n\n- Location\n\n\n\nBengaluru, India\n\n\n- Education\n\n\n\nB. Tech in computer science\n\n\n- Work\n\n\n\nTech lead\n\n\n- Joined\n\n\nOct 1, 2019\n\n\n• [Feb 25 '25](https://dev.to/dzakh/javascript-schema-library-from-the-future-5420#comment-2m2lh)\n\nDropdown menu\n\n- [Copy link](https://dev.to/dzakh/javascript-schema-library-from-the-future-5420#comment-2m2lh)\n- Hide\n\n- [Report abuse](https://dev.to/report-abuse?url=https://dev.to/dhruvgarg79/comment/2m2lh)\n\nwhat about comparison with typebox? It's also much faster than zod.\n\nCollapseExpand\n\n[](https://dev.to/dzakh)\n\n[Dmitry Zakharov](https://dev.to/dzakh)\n\nDmitry Zakharov\n\n\n\n[\\\\\nDmitry Zakharov](https://dev.to/dzakh)\n\nFollow\n\nBuild fastest tools with best DX 🫡\n\n\n- Location\n\n\n\nGeorgia, Batumi\n\n\n- Work\n\n\n\nEnvio\n\n\n- Joined\n\n\nDec 11, 2022\n\n\n• [Feb 26 '25](https://dev.to/dzakh/javascript-schema-library-from-the-future-5420#comment-2m300)\n\nDropdown menu\n\n- [Copy link](https://dev.to/dzakh/javascript-schema-library-from-the-future-5420#comment-2m300)\n- Hide\n\n- [Report abuse](https://dev.to/report-abuse?url=https://dev.to/dzakh/comment/2m300)\n\nThis is actually very good, and it's very mature. I actually had a misunderstanding about it being a worse version of Typia, but after double-checking the docs, I was really impressed by it.\n\nIn the benchmark, you can indeed see that it's fast [moltar.github.io/typescript-runtim...](https://moltar.github.io/typescript-runtime-type-benchmarks/)\n\nBut there are some trade-offs that are solved in ReScript Schema:\n\n- Optimised check only supports validation, not parsing with data transformations\n- I find the DX of ReScript Schema to be more friendly for web developers. Also, reshaping and reversing are still unbeaten\n- The TypeBox packages size is huge, making it not the best fit for web development [github.com/sinclairzx81/typebox?ta...](https://github.com/sinclairzx81/typebox?tab=readme-ov-file#compression)\n\nSo, at the moment of writing the article I think ReScript Schema is a better library if you use it for Web, but for server-side TypeBox is more mature and provides more flexibility and features. Although there are still some features of ReScript Schema you might want to use, which are not a part of TypeBox 😉\n\nReScript Schema v10 is coming, which will improve the flexibility similar to TypeBox while boosting DX even more, exceeding Zod and ArkType levels 😁\n\nCollapseExpand\n\n[](https://dev.to/dzakh)\n\n[Dmitry Zakharov](https://dev.to/dzakh)\n\nDmitry Zakharov\n\n\n\n[\\\\\nDmitry Zakharov](https://dev.to/dzakh)\n\nFollow\n\nBuild fastest tools with best DX 🫡\n\n\n- Location\n\n\n\nGeorgia, Batumi\n\n\n- Work\n\n\n\nEnvio\n\n\n- Joined\n\n\nDec 11, 2022\n\n\n• [Feb 26 '25](https://dev.to/dzakh/javascript-schema-library-from-the-future-5420#comment-2m305)\n\nDropdown menu\n\n- [Copy link](https://dev.to/dzakh/javascript-schema-library-from-the-future-5420#comment-2m305)\n- Hide\n\n- [Report abuse](https://dev.to/report-abuse?url=https://dev.to/dzakh/comment/2m305)\n\nOk, I decided to double-check the package size table from their docs and it actually happened that the package size is not big [bundlephobia.com/package/@sinclair...](https://bundlephobia.com/package/@sinclair/typebox@0.34.28)\n\nAnother thing to compare is the much more readable error messages by default in ReScript Schema.\n\n[](https://dev.to/dhruvgarg79)\n\n[Dhruv garg](https://dev.to/dhruvgarg79)\n\nDhruv garg\n\n\n\n[\\\\\nDhruv garg](https://dev.to/dhruvgarg79)\n\nFollow\n\nWorking as a Tech Lead at a MarTech Startup.\nInterested in Databases, Performance, and everything Backend.\n\n\n- Location\n\n\n\nBengaluru, India\n\n\n- Education\n\n\n\nB. Tech in computer science\n\n\n- Work\n\n\n\nTech lead\n\n\n- Joined\n\n\nOct 1, 2019\n\n\n• [Mar 18 '25](https://dev.to/dzakh/javascript-schema-library-from-the-future-5420#comment-2meh7)\n\nDropdown menu\n\n- [Copy link](https://dev.to/dzakh/javascript-schema-library-from-the-future-5420#comment-2meh7)\n- Hide\n\n- [Report abuse](https://dev.to/report-abuse?url=https://dev.to/dhruvgarg79/comment/2meh7)\n\nI will give it a try in near future, thanks for amazing library my friend :)\n\nCollapseExpand\n\n[](https://dev.to/alexdev404)\n\n[Immanuel Garcia](https://dev.to/alexdev404)\n\nImmanuel Garcia\n\n\n\n[\\\\\nImmanuel Garcia](https://dev.to/alexdev404)\n\nFollow\n\n- Joined\n\n\nMay 6, 2020\n\n\n• [Feb 23 '25](https://dev.to/dzakh/javascript-schema-library-from-the-future-5420#comment-2m1h4)\n\nDropdown menu\n\n- [Copy link](https://dev.to/dzakh/javascript-schema-library-from-the-future-5420#comment-2m1h4)\n- Hide\n\n- [Report abuse](https://dev.to/report-abuse?url=https://dev.to/alexdev404/comment/2m1h4)\n\nSo why even use this if you can just use Zod or Valibot, bypassing any or all of that `eval` magic you did just for a few extra kilobytes?\n\nCollapseExpand\n\n[](https://dev.to/dzakh)\n\n[Dmitry Zakharov](https://dev.to/dzakh)\n\nDmitry Zakharov\n\n\n\n[\\\\\nDmitry Zakharov](https://dev.to/dzakh)\n\nFollow\n\nBuild fastest tools with best DX 🫡\n\n\n- Location\n\n\n\nGeorgia, Batumi\n\n\n- Work\n\n\n\nEnvio\n\n\n- Joined\n\n\nDec 11, 2022\n\n\n• [Feb 24 '25• Edited on Feb 24• Edited](https://dev.to/dzakh/javascript-schema-library-from-the-future-5420#comment-2m1j5)\n\nDropdown menu\n\n- [Copy link](https://dev.to/dzakh/javascript-schema-library-from-the-future-5420#comment-2m1j5)\n- Hide\n\n- [Report abuse](https://dev.to/report-abuse?url=https://dev.to/dzakh/comment/2m1j5)\n\nEval actually makes the size bigger 😅\n\nThere are some unique features you can't find in any other library together:\n\n- Nice API with good DX\n- Top performance\n- Ability to conveniently and efficiently transform data when you parse\n- Ability to transform data without validation\n- Ability to get schema for the output type\n- Flexible set of operations\n\nIf you don't need it, then use Zod or Valibot. Both of them are good libraries I like.\n\nCollapseExpand\n\n[](https://dev.to/jpeggdev)\n\n[Jeff Pegg](https://dev.to/jpeggdev)\n\nJeff Pegg\n\n\n\n[\\\\\nJeff Pegg](https://dev.to/jpeggdev)\n\nFollow\n\n- Location\n\n\n\nTulsa, Oklahoma\n\n\n- Joined\n\n\nDec 4, 2024\n\n\n• [Mar 2 '25](https://dev.to/dzakh/javascript-schema-library-from-the-future-5420#comment-2m5ei)\n\nDropdown menu\n\n- [Copy link](https://dev.to/dzakh/javascript-schema-library-from-the-future-5420#comment-2m5ei)\n- Hide\n\n- [Report abuse](https://dev.to/report-abuse?url=https://dev.to/jpeggdev/comment/2m5ei)\n\nHi Dmitry, nice article. In your last code example showing the under the hood code, on the 3rd line it says e [7](https://dev.toi/), where does the capital I come from or is that a typo?\n\nCollapseExpand\n\n[](https://dev.to/dzakh)\n\n[Dmitry Zakharov](https://dev.to/dzakh)\n\nDmitry Zakharov\n\n\n\n[\\\\\nDmitry Zakharov](https://dev.to/dzakh)\n\nFollow\n\nBuild fastest tools with best DX 🫡\n\n\n- Location\n\n\n\nGeorgia, Batumi\n\n\n- Work\n\n\n\nEnvio\n\n\n- Joined\n\n\nDec 11, 2022\n\n\n• [Mar 2 '25](https://dev.to/dzakh/javascript-schema-library-from-the-future-5420#comment-2m5f0)\n\nDropdown menu\n\n- [Copy link](https://dev.to/dzakh/javascript-schema-library-from-the-future-5420#comment-2m5f0)\n- Hide\n\n- [Report abuse](https://dev.to/report-abuse?url=https://dev.to/dzakh/comment/2m5f0)\n\nHm, this looks like a copy-paste bug from Google Docs where I initially written the article. It should be a lower case i. As for `e` it comes from the function context and used for safe embedding to eval code.\n\nCollapseExpand\n\n[](https://dev.to/jpeggdev)\n\n[Jeff Pegg](https://dev.to/jpeggdev)\n\nJeff Pegg\n\n\n\n[\\\\\nJeff Pegg](https://dev.to/jpeggdev)\n\nFollow\n\n- Location\n\n\n\nTulsa, Oklahoma\n\n\n- Joined\n\n\nDec 4, 2024\n\n\n• [Mar 2 '25](https://dev.to/dzakh/javascript-schema-library-from-the-future-5420#comment-2m5f6)\n\nDropdown menu\n\n- [Copy link](https://dev.to/dzakh/javascript-schema-library-from-the-future-5420#comment-2m5f6)\n- Hide\n\n- [Report abuse](https://dev.to/report-abuse?url=https://dev.to/jpeggdev/comment/2m5f6)\n\nI didn't even notice it stripped the brackets and parenthesis from my comment.\n\n`e[7](I)`\n\nCollapseExpand\n\n[](https://dev.to/ravi-coding)\n\n[Ravindra Kumar](https://dev.to/ravi-coding)\n\nRavindra Kumar\n\n\n\n[\\\\\nRavindra Kumar](https://dev.to/ravi-coding)\n\nFollow\n\nFull-Stack Developer \\| MERN & Python \\| Passionate about building web apps and OpenAi APIs. Always learning and sharing knowledge with the community. Let's connect and create something awesome! 🚀\n\n\n- Email\n\n\n[rk2671353@gmail.com](mailto:rk2671353@gmail.com)\n\n- Location\n\n\n\nNew Delhi\n\n\n- Education\n\n\n\n2016\n\n\n- Pronouns\n\n\n\nHe/him\n\n\n- Work\n\n\n\nFull-Stack Developer \\| MERN & Django Specialist \\| Currently enhancing skills in AWS and cloud tech\n\n\n- Joined\n\n\nSep 5, 2024\n\n\n• [Feb 22 '25](https://dev.to/dzakh/javascript-schema-library-from-the-future-5420#comment-2m0on)\n\nDropdown menu\n\n- [Copy link](https://dev.to/dzakh/javascript-schema-library-from-the-future-5420#comment-2m0on)\n- Hide\n\n- [Report abuse](https://dev.to/report-abuse?url=https://dev.to/ravi-coding/comment/2m0on)\n\nAwesome !\n\nCollapseExpand\n\n[](https://dev.to/jesterly)\n\n[jesterly](https://dev.to/jesterly)\n\njesterly\n\n\n\n[\\\\\njesterly](https://dev.to/jesterly)\n\nFollow\n\n- Joined\n\n\nFeb 10, 2025\n\n\n• [Feb 26 '25](https://dev.to/dzakh/javascript-schema-library-from-the-future-5420#comment-2m33c)\n\nDropdown menu\n\n- [Copy link](https://dev.to/dzakh/javascript-schema-library-from-the-future-5420#comment-2m33c)\n- Hide\n\n- [Report abuse](https://dev.to/report-abuse?url=https://dev.to/jesterly/comment/2m33c)\n\nVery cool, and thanks for the heads up about eval. It's a shame we can't use this in browser extensions because eval is not allowed in MV3 :-(.\n\nCollapseExpand\n\n[](https://dev.to/dzakh)\n\n[Dmitry Zakharov](https://dev.to/dzakh)\n\nDmitry Zakharov\n\n\n\n[\\\\\nDmitry Zakharov](https://dev.to/dzakh)\n\nFollow\n\nBuild fastest tools with best DX 🫡\n\n\n- Location\n\n\n\nGeorgia, Batumi\n\n\n- Work\n\n\n\nEnvio\n\n\n- Joined\n\n\nDec 11, 2022\n\n\n• [Apr 13 '25](https://dev.to/dzakh/javascript-schema-library-from-the-future-5420#comment-2n2h8)\n\nDropdown menu\n\n- [Copy link](https://dev.to/dzakh/javascript-schema-library-from-the-future-5420#comment-2n2h8)\n- Hide\n\n- [Report abuse](https://dev.to/report-abuse?url=https://dev.to/dzakh/comment/2n2h8)\n\nFinishing V10 with some fantastic improvements. I'm ready to take over the world 😁\n\n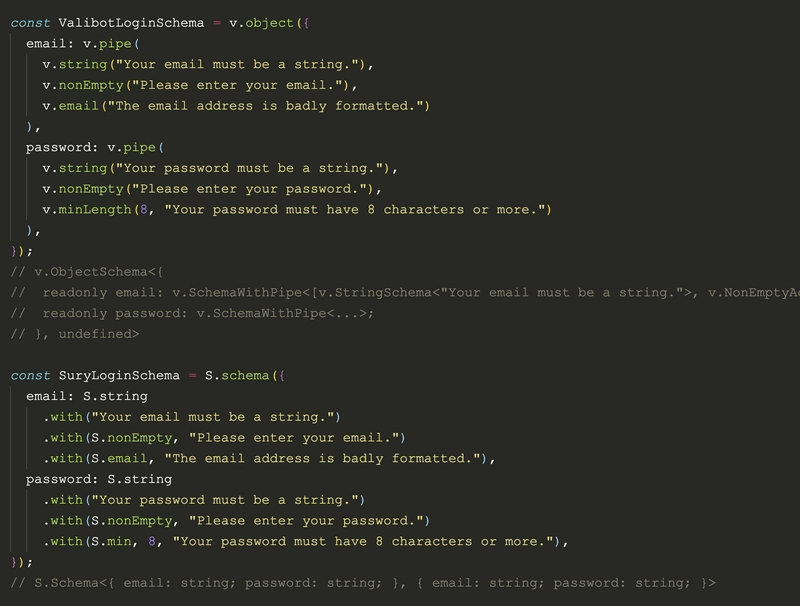\n\n[View full discussion (16 comments)](https://dev.to/dzakh/javascript-schema-library-from-the-future-5420/comments)\n\nAre you sure you want to hide this comment? It will become hidden in your post, but will still be visible via the comment's [permalink](https://dev.to/dzakh/javascript-schema-library-from-the-future-5420#).\n\n\nHide child comments as well\n\nConfirm\n\n\nFor further actions, you may consider blocking this person and/or [reporting abuse](https://dev.to/report-abuse)\n\n[\\\\\nBright Data](https://dev.to/bright-data) Promoted\n\nDropdown menu\n\n- [What's a billboard?](https://dev.to/billboards)\n- [Manage preferences](https://dev.to/settings/customization#sponsors)\n\n* * *\n\n- [Report billboard](https://dev.to/report-abuse?billboard=246460)\n\n[](https://dev.to/joupify/soc-cert-automated-threat-intelligence-system-with-n8n-ai-5722?bb=246460)\n\n## [SOC-CERT: Automated Threat Intelligence System with n8n & AI](https://dev.to/joupify/soc-cert-automated-threat-intelligence-system-with-n8n-ai-5722?bb=246460)\n\nCheck out this submission for the [AI Agents Challenge powered by n8n and Bright Data](https://dev.to/challenges/brightdata-n8n-2025-08-13?bb=246460).\n\n[Read more →](https://dev.to/joupify/soc-cert-automated-threat-intelligence-system-with-n8n-ai-5722?bb=246460)\n\n👋 Kindness is contagious\n\nDropdown menu\n\n- [What's a billboard?](https://dev.to/billboards)\n- [Manage preferences](https://dev.to/settings/customization#sponsors)\n\n* * *\n\n- [Report billboard](https://dev.to/report-abuse?billboard=239338)\n\nx\n\nExplore this practical breakdown on DEV’s open platform, where developers from every background come together to push boundaries. **No matter your experience,** your viewpoint enriches the conversation.\n\nDropping a simple “thank you” or question in the comments goes a long way in supporting authors—your feedback helps ideas evolve.\n\nAt DEV, **shared discovery drives progress** and builds lasting bonds. If this post resonated, a quick nod of appreciation can make all the difference.\n\n## [Okay](https://dev.to/enter?state=new-user&bb=239338)\n\n\n\nWe're a place where coders share, stay up-to-date and grow their careers.\n\n\n[Log in](https://dev.to/enter?signup_subforem=1) [Create account](https://dev.to/enter?signup_subforem=1&state=new-user)\n\n","metadata":{"head-cached-at":"1774619422","og:title":"JavaScript schema library from the Future 🧬","theme-color":["#ffffff","#000000"],"last-updated":"2026-03-27 13:50:22 UTC","ogImage":"https://media2.dev.to/dynamic/image/width=1000,height=500,fit=cover,gravity=auto,format=auto/https%3A%2F%2Fdev-to-uploads.s3.amazonaws.com%2Fuploads%2Farticles%2Fn102ksd9w1xo5ysgxbur.png","twitter:widgets:new-embed-design":"on","og:url":"https://dev.to/dzakh/javascript-schema-library-from-the-future-5420","ogTitle":"JavaScript schema library from the Future 🧬","robots":"max-snippet:-1, max-image-preview:large, max-video-preview:-1","twitter:image:src":"https://media2.dev.to/dynamic/image/width=1000,height=500,fit=cover,gravity=auto,format=auto/https%3A%2F%2Fdev-to-uploads.s3.amazonaws.com%2Fuploads%2Farticles%2Fn102ksd9w1xo5ysgxbur.png","apple-mobile-web-app-title":"dev.to","application-name":"dev.to","csrf-token":"Zaxe-092G0zAA0HFwn9lahOGpju8s9tGVoewgHTJx4Nl8W4q4ahTyB3O95CU560sPkhsC6oYVYEdBNbBCMhyPA","environment":"production","og:type":"article","og:description":"ReScript Schema - The fastest parser in the entire JavaScript ecosystem with a focus on small bundle...","user-signed-in":"false","description":"ReScript Schema - The fastest parser in the entire JavaScript ecosystem with a focus on small bundle... Tagged with schema, typescript, rescript, opensource.","title":"JavaScript schema library from the Future 🧬 - DEV Community","forem:domain":"dev.to","language":"en","ogDescription":"ReScript Schema - The fastest parser in the entire JavaScript ecosystem with a focus on small bundle...","twitter:creator":"@dzakh_dev","ogUrl":"https://dev.to/dzakh/javascript-schema-library-from-the-future-5420","forem:logo":"https://media2.dev.to/dynamic/image/width=512,height=,fit=scale-down,gravity=auto,format=auto/https%3A%2F%2Fdev-to-uploads.s3.amazonaws.com%2Fuploads%2Farticles%2F8j7kvp660rqzt99zui8e.png","search-script":"https://assets.dev.to/assets/Search-b977aea0f2d7a5818b4ebd97f7d4aba8548099f84f5db5761f8fa67be76abc54.js","keywords":"schema, typescript, rescript, opensource, software, coding, development, engineering, inclusive, community","og:image":"https://media2.dev.to/dynamic/image/width=1000,height=500,fit=cover,gravity=auto,format=auto/https%3A%2F%2Fdev-to-uploads.s3.amazonaws.com%2Fuploads%2Farticles%2Fn102ksd9w1xo5ysgxbur.png","forem:name":"DEV Community","csrf-param":"authenticity_token","og:site_name":"DEV Community","twitter:description":"ReScript Schema - The fastest parser in the entire JavaScript ecosystem with a focus on small bundle...","viewport":"width=device-width, initial-scale=1.0, viewport-fit=cover","ogSiteName":"DEV Community","twitter:title":"JavaScript schema library from the Future 🧬","twitter:card":"summary_large_image","twitter:site":"@thepracticaldev","favicon":"https://media2.dev.to/dynamic/image/width=32,height=,fit=scale-down,gravity=auto,format=auto/https%3A%2F%2Fdev-to-uploads.s3.amazonaws.com%2Fuploads%2Farticles%2F8j7kvp660rqzt99zui8e.png","scrapeId":"019d3958-259f-74ed-8ae7-fea06e77f4bd","sourceURL":"https://dev.to/dzakh/javascript-schema-library-from-the-future-5420","url":"https://dev.to/dzakh/javascript-schema-library-from-the-future-5420","statusCode":200,"contentType":"text/html; charset=utf-8","proxyUsed":"basic","cacheState":"hit","cachedAt":"2026-03-29T11:21:07.369Z","creditsUsed":1}}]}}